
Section 5.2 View Student Activity
Subsection 5.2.1 Introduction
In the new Instructor Dashboard, you can view student activity reports such as Chapter Activity and Exercise Metrics in the Course Analytics menu. You can also download the course logs and csv files.

The following student activities are logged:
-
Loading a book page
-
Answering a multiple choice question
-
Answering a mixed-up code (Parsons) problem
-
Running code in an ActiveCode window
-
Editing code in an ActiveCode window
-
Playing a video
The following video provides an overview of the various student activity reports (in the older interface):
Subsection 5.2.2 Students Online
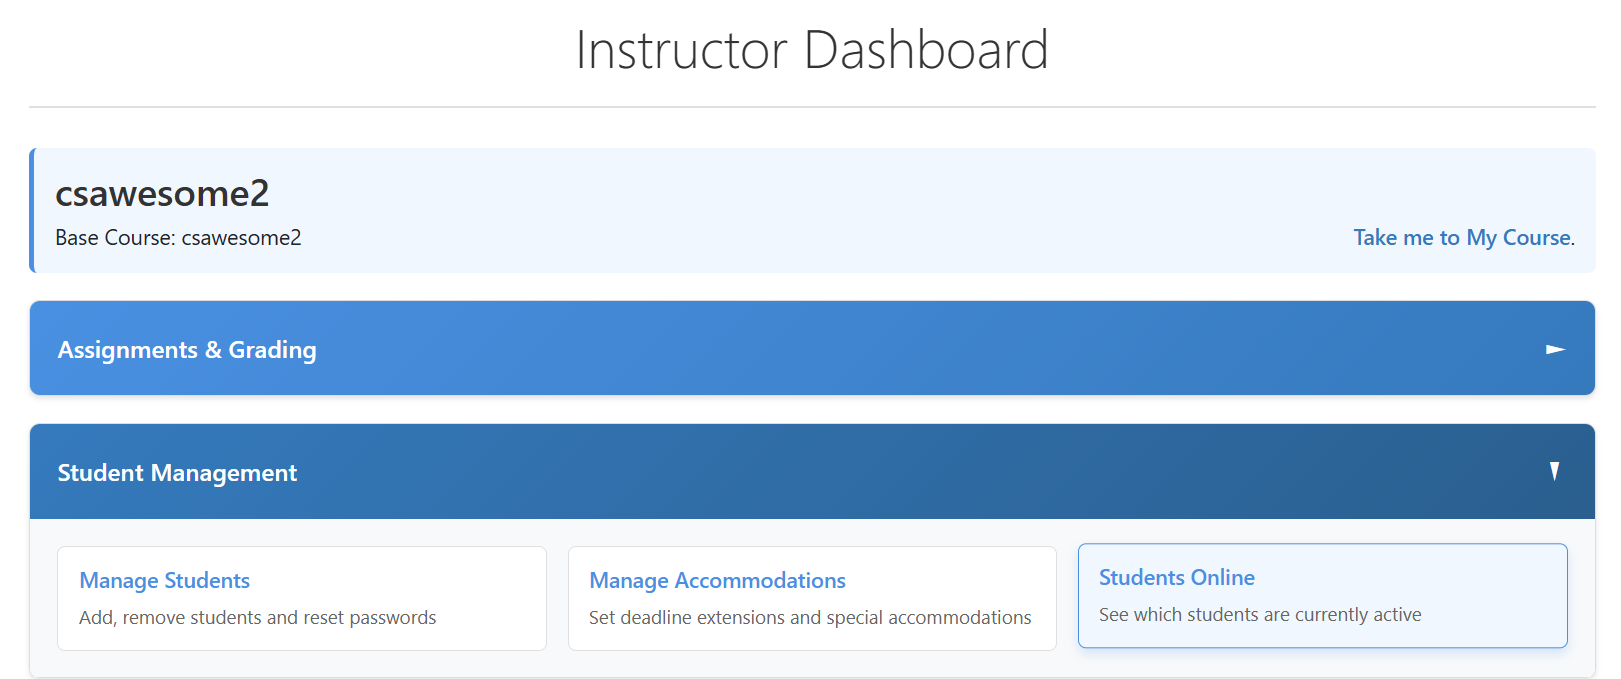
Under Student Management, you can add and remove students from your class, reset their passwords, manage accommodations, and view students online and what page they are working on in real time.
Subsection 5.2.3 Chapter Activity
One very easy to use report that allows you to quickly see how much work your students are doing on each page is the Chapter Activity report found under Course Analytics.
On the Chapter Activity (Student Progress) page, pull down the first menu to select a chapter and pull down the second menu to see different reports on the count of activities that students have completed and how many were correct, as well as their first and last interaction date/times. These reports can be downloaded as CSV files and can be opened as spreadsheets. You can also filter by chapter or any other search criteria using the down arrow next to the column headers.
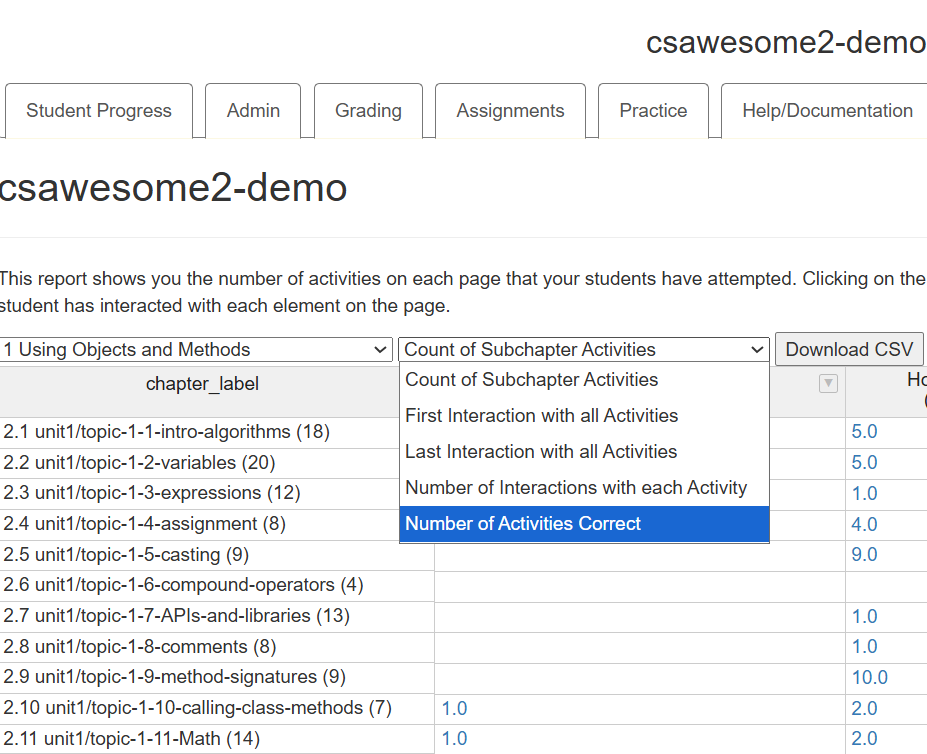
.
The numbers in each cell are clickable so you can drill down into a particular page for a particular student to see what they have done and the number of interactions with each element.
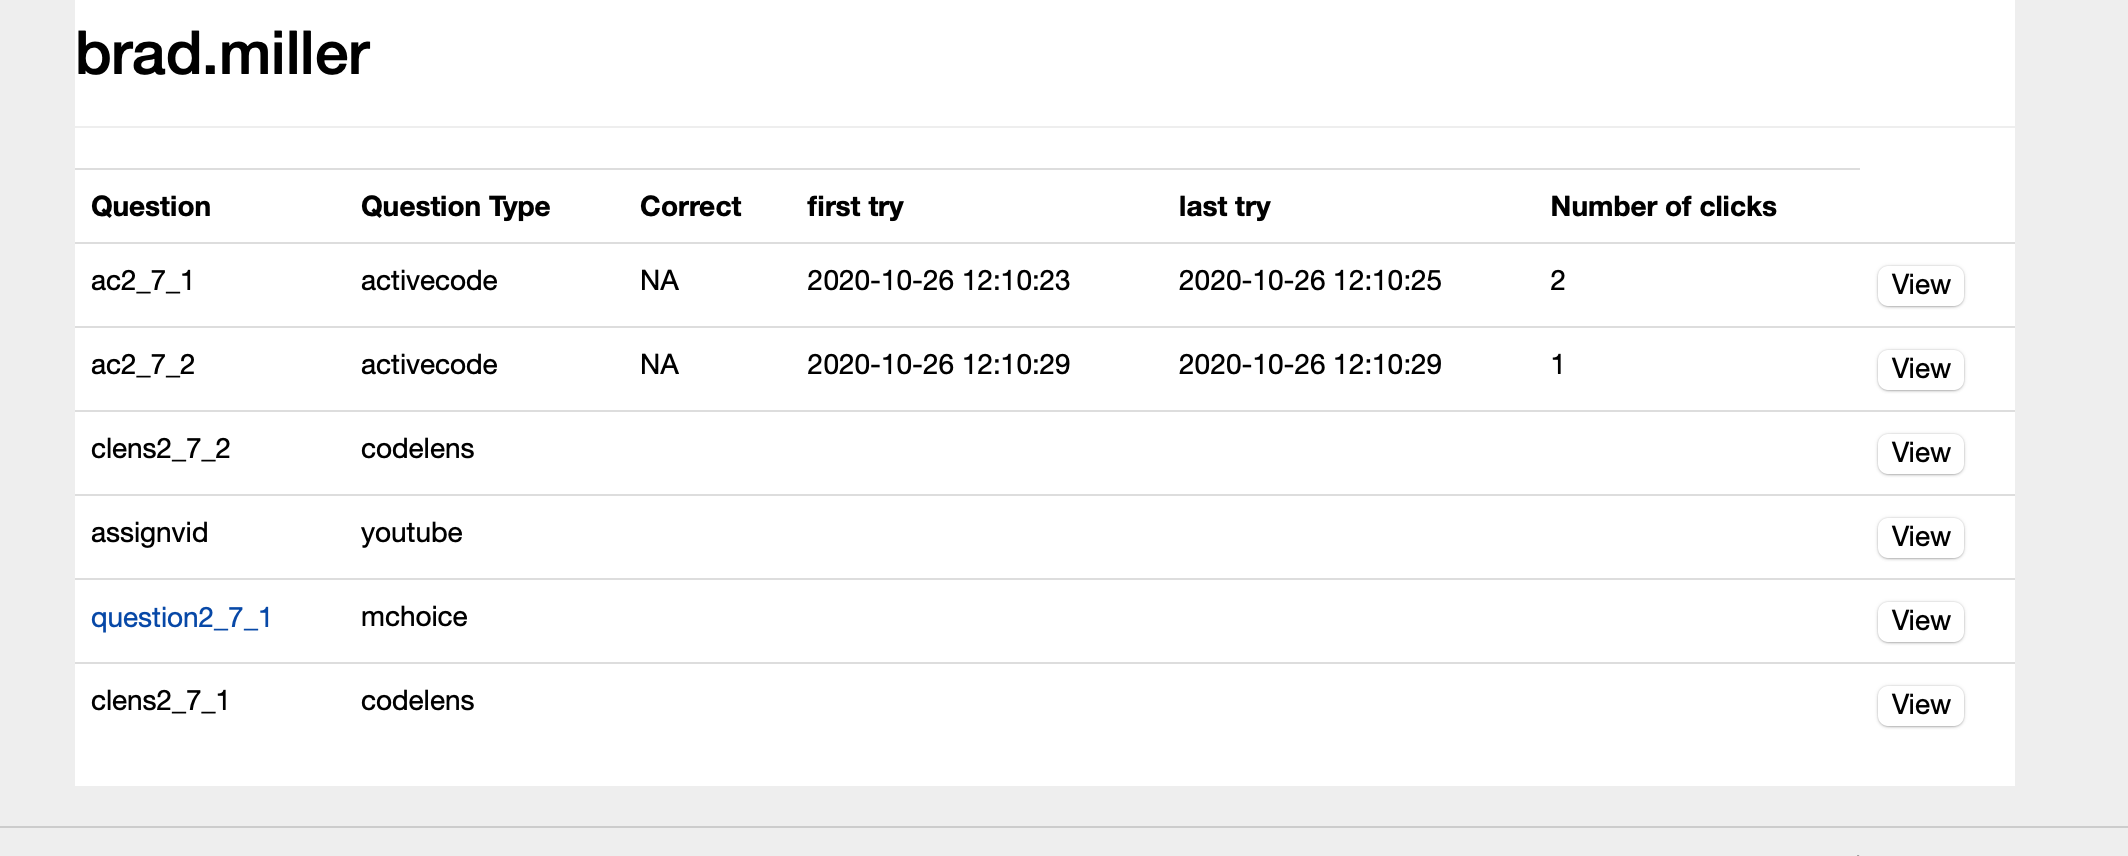
You can even click the view button to see a preview of the activity. Clicking on the Question link will bring you the summary page for that activity where you can see an aggregate of how all students performed on that question. We’ll see more about that report shortly.
Subsection 5.2.4 Student Progress: Exercise Metrics
The instructor interface lets you see summaries of some of these activities that may be useful to you. To get started, from the instructor Dashboard, click on Course Analytics and then Exercise Metrics.
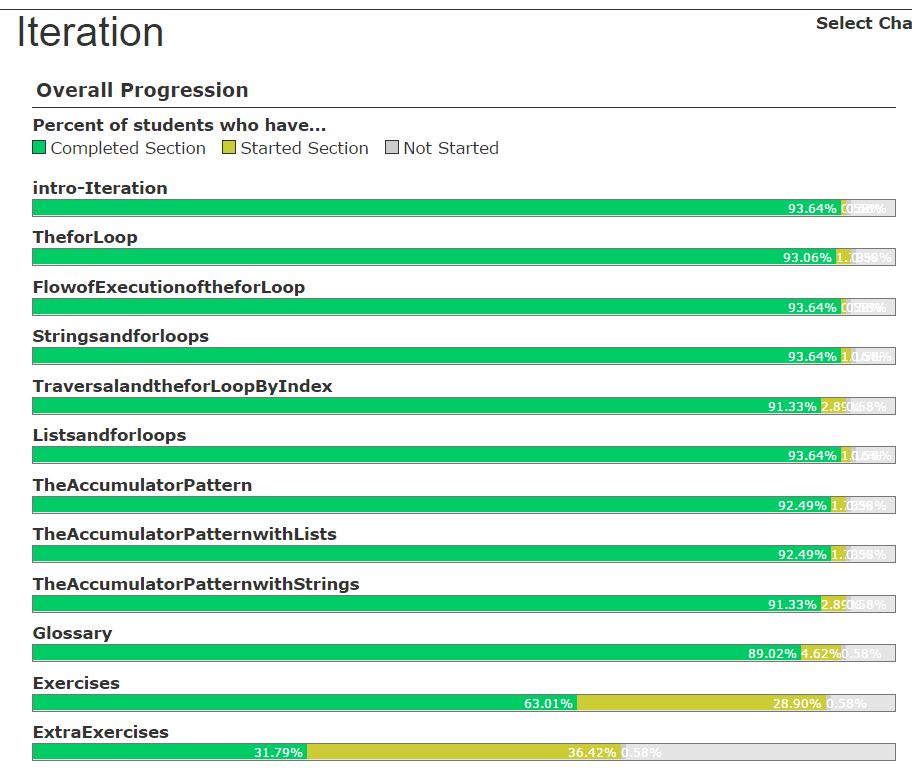
If you have assigned students to read a particular chapter prior to (or after) class, you can see at a glance what percentage of them have looked at each of the pages in a chapter. In the upper right hand corner, you can select a chapter. Then look at the left side.
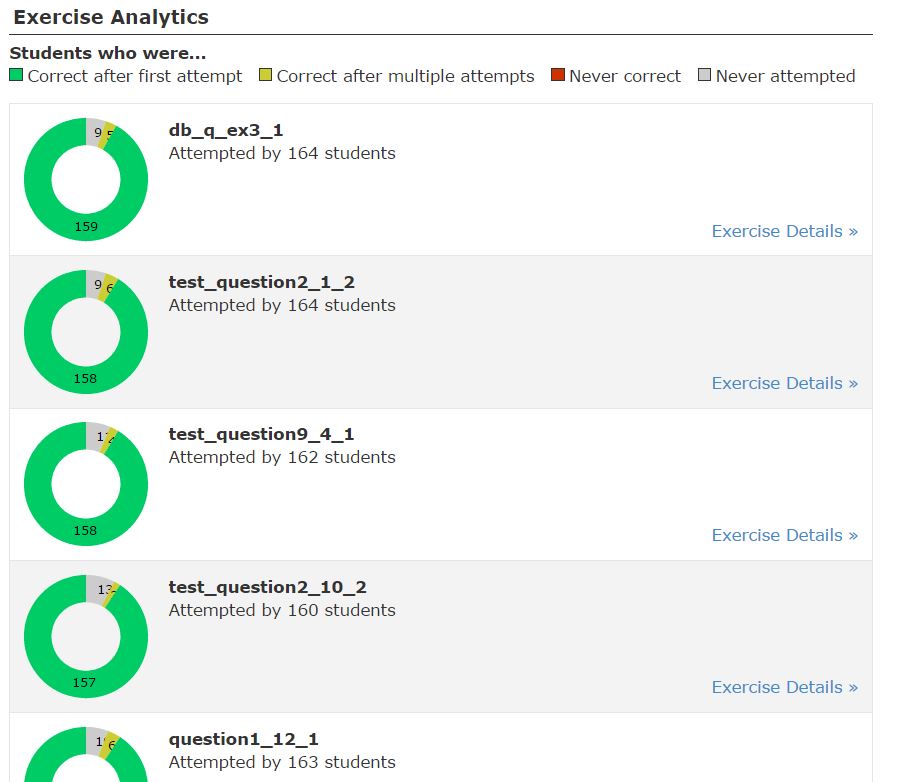
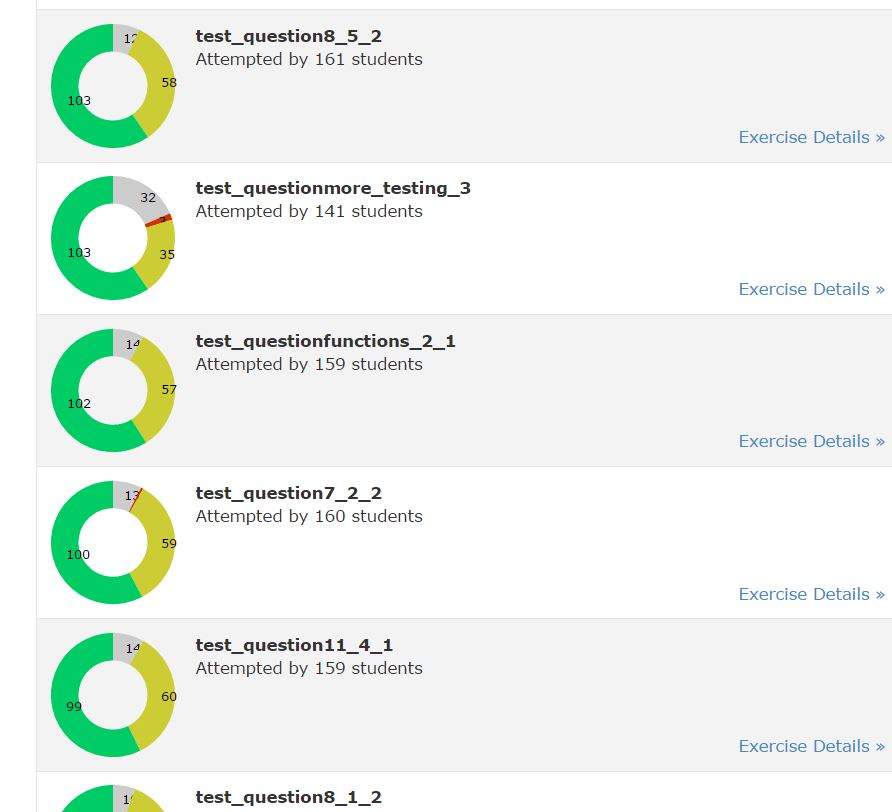
You can see how students did on the multiple choice problems in the chapter. Some instructors have found it useful to focus in class on those questions where many students got the question wrong initially. Currently, the interface sorts the questions in order of the percentage of students who got them right the first time, so you may want to scroll down to find the ones they had trouble with.
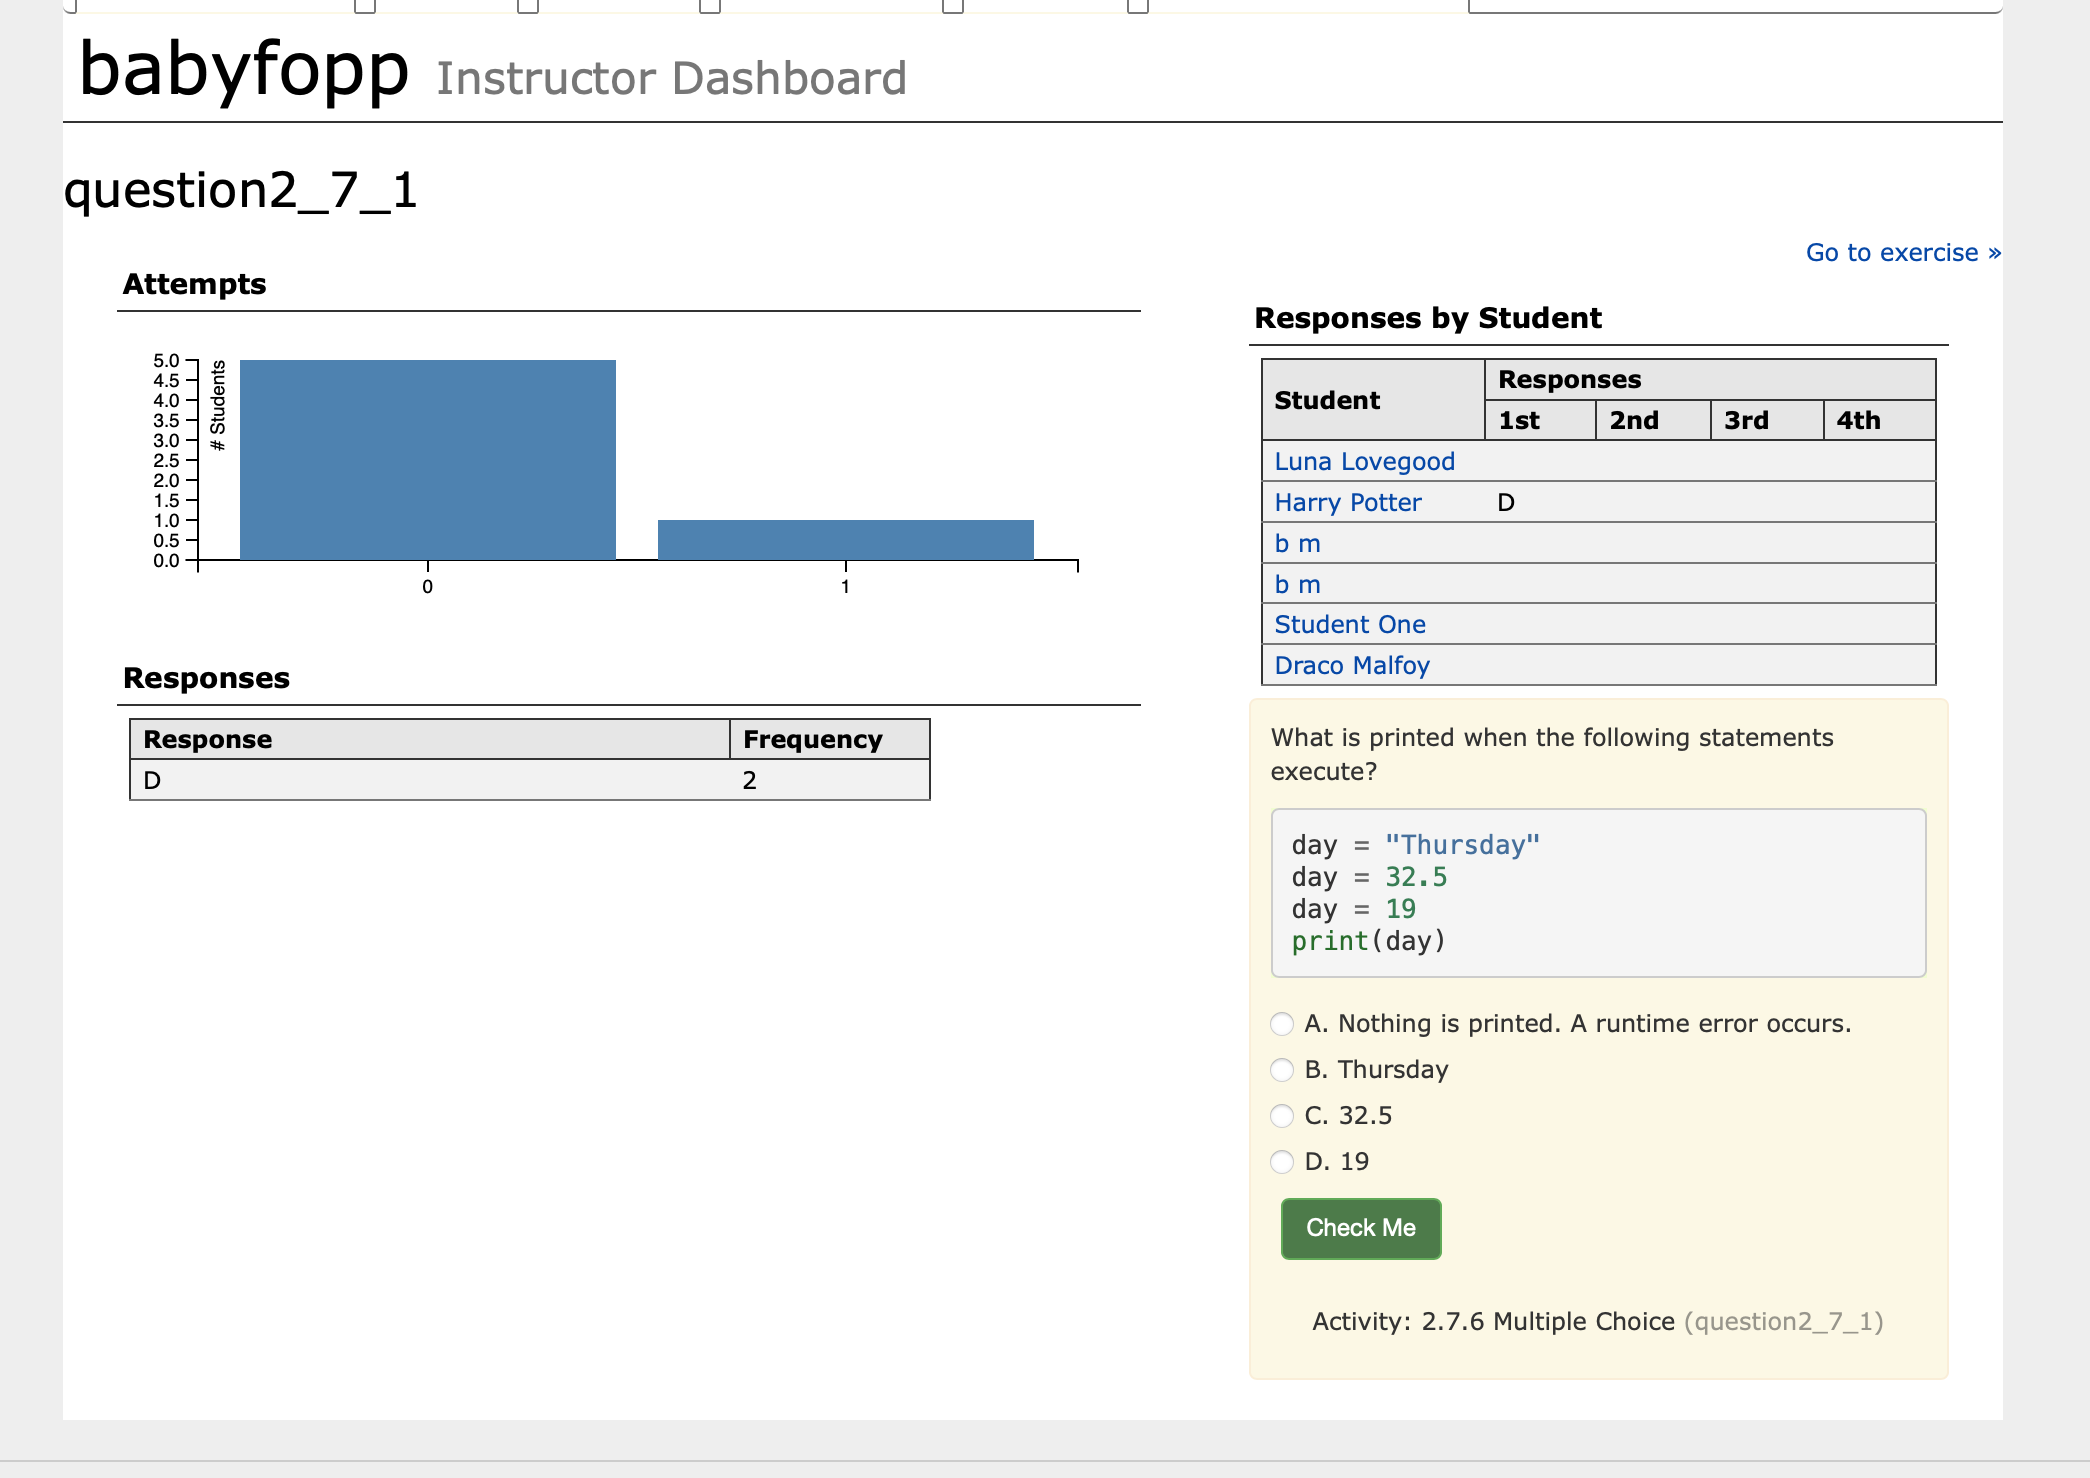
This page is further drilldown on an individual question. You can see a histogram of the number of attempts made on the question across the class, you can see the frequency with which each option was selected, and you can see the first four responses of each student. You can also see a preview of the question.
